

Are women worse, or are they scarce? Population sizes and the gender gap in chess
A recent article in Chessbase magazine, written by the professor of psychology and neuroscience and FIDE Master Wei Ji Ma, claimed that population sizes fully explain the gender gap in top chess. In other word, his thesis is that differences in participation between women and men are the reason for the underachievement of women.[1] In this article, we will put together all the arguments that have been made with respect to this claim, and we will analyze them for a better understanding of this contemporary issue.
Contents:
- Introduction to the gender gap in chess.
- Review of the recently published articles on population sizes and the gender gap in chess.
- Short summary of the history of this debate in the scientific literature.
- Old arguments against the hypothesis – Robert Howard
- Criticism of Howard’s original paper – Bilalic and McLeod 2007.
- The participation rate hypothesis – Bilalic and collegues 2009.
- Refutation of the methods by Bilalic and Colleagues – Knapp 2010.
- So where did Bilalic and McLeod go wrong? – Weisend 2019.
- Layman analysis of the problem.
- Conclusions.
- References
Review of the recently published articles on population sizes and the gender gap in chess
The gender gap in chess, an apparently obvious fact
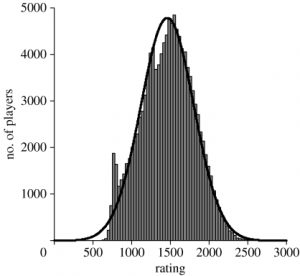
On the face of it, this theory could be instantaneously dismissed: there is only one woman among the top-200 active players. Only 7 women make the top-500 (Hou, Koneru, Goryakina, Ju, Lagno, Mariya Muzychuk and Anna Muzychuk). Meanwhile, the 10th woman in the ranking (Tan Zhong Yi) is ranked 648th among active players.[2] Not a promising picture for the participation rate hypothesis, considering that about 12% of FIDE affiliations are women.[3] We should keep in mind that, being the distribution of chess ratings approximately normal, the proportion of women should be stable across the distribution, provided that the average and dispersion of the male and female population are the same.
This could be a colossal statistical fluke if it wasn’t for the fact that it has been consistent throughout history. Only 2 women have reached the top-50 ever since the first Elo list in 1971: these are the retired chess prodigy Judit Polgar (now insightful chess commentator), and Maya Chiburdanidze, who reached position 48th of the list in June 1988. Along with Hou Yifan, they are the only 3 women who ever made it to the top-100.[4] It seems unlikely that this underrepresentation has occurred by chance or by the sheer differential in participation. Then, how can serious researchers claim otherwise?
An attempt to resurrect the participation rate hypothesis – Professor Wei Ji Ma for Chessbase

Let us analyze what professor Ma did. He took a sample of Indian players from the FIDE rating list. He eliminated junior players from his sample because of their greater rating variability, and found that the average rating of a female players is superior to that of males. But, wait a second, isn’t this cherry picking? Junior players constitute more than half the sample after all, and greater statistical variance would average out across such a large population.
So I took Professor Ma’s sample and verified that his calculations were correct, as it was the case. If the selection of the adult sample was biased, one would expect to get a skewed distribution. However, his distributions were approximately normal (bell-shaped). And in fact his adult male sample had a slightly more positive skewness than the adult female sample.[3] In any case, he used data exclusively from India, and this is indeed cherry picking, because the objective is to analyze the gender gap and not any particular aspect of Indian society. So what about the other countries?
A larger and more diverse sample – Camacho for chess24
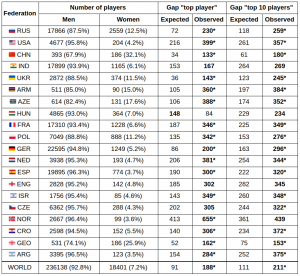
A more honest analysis was performed by mathematician and International Master Marcos Camacho, in his article published in chess24 just a few weeks ago. He analyzed the top-10 of each of the top-20 federations in the world according to FIDE. And indeed, men were better in every single country, after correcting for population sizes, with 16 of those 20 comparisons reaching statistical significance (a standard threshold of confidence used in social science to determine scientific truth). When taking the overall samples (of adult chess populations), 17 of the 20 countries showed average male dominance.[5] Interestingly, 2 countries showed a statistically significant female superiority, one being Georgia and the other India, the very country used in the analysis of the Chessbase article mentioned above.
We must congratulate Professor Ma for finding the one sample in which women are better than men at chess. Apart from this, I see no reason to conclude, as he does with great conviction, that the gender gap in top chess is explained by population sizes.
What may explain the biased result of the Indian sample?
Let us now analyze the possible causes for this sharp contrast between the Indian sample and the facts exposed above. As I said, Professor Ma’s selection was unbiased. However, if you take the whole of the sample of Indian players (including juniors), males have a very large advantage over female players. On top of that, the ratio of junior to adult players is much larger in the female sample, suggesting that young women could be dropping out in larger numbers than men.[3] I mentioned above that a selection for rating would skew an a priori normal distribution. However, this process of selection is different because it happens progressively. The Elo rating list is constantly updated, and a player’s position in the rankings is variable. Therefore, any possible skewness produced by a biased selection would dissipate over time due to a phenomenon called “regression to (or towards) the mean”.
Example of a biased selection process
Let us imagine that we select players from the current FIDE list, with a preference for higher ratings. This would make the bottom of the distribution less dense than the top, thus skewing it to the right. However, if we selected young players based on their superior talent, the most talented would sooner or later “regress to the mean” of the rating distribution, and so would the least talented, balancing out the skewness created by the selection process. In addition, the Indian population is highly stratified. Any gender-based selection process of Indian chess players, for instance by social class, would bias the results.
Short summary of the history of populations sizes and the gender gap in chess in the scientific literature
Old arguments against the hypothesis – Robert Howard
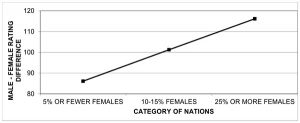
This talent selection process was already pointed out several years ago by Robert Howard, the most prominent detractor of the participation rate hypothesis. He demonstrated that the gender gap increases as the proportion of women increases, and claimed that smaller samples tend to be more selective talent-wise. Countries with greater female participation tend to show a greater gender gap, which is inconsistent with the participation rate hypothesis.[6]
Gender gap in chess over time
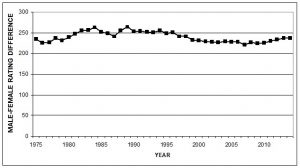
Howard also showed that the gender gap in chess has been consistent over time, as I anticipated above. In his paper of 2005, he analyzed data from 1975 to 2004, which he later extended until 2014, showing great consistency at close to 250 points, one standard deviation.[6]
Correcting for confounding factors affecting chess ratings
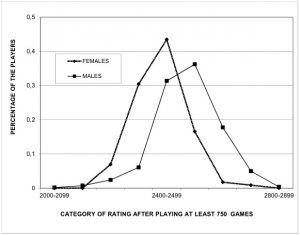
On top of this, he adjusted his results to correct for the greater number of games played by the male population. The amount of competitive games played is known to be one of the main predictors of chess strength,[7] so this correction was necessary. He compared women and men with more than 750 games, arguably the number of games necessary to reach one’s peak. However, this had no effect and the gender gap remained.[6]
Criticism of Howard’s original paper – Merim Bilalic and Peter McLeod 2007
Bilalic and McLeod criticized the original paper by Howard (2005). Their argument had two main points: 1- Howard’s sample was corrupted by the lowering of the Elo rating floor by FIDE (the International Federation decreased the minimum rating a player could get); 2- It was too selectively based on the top of the distribution. Indeed, FIDE’s original rating cutoff was 2200, several standard deviations above the mean of the distribution.[8]
The participation rate hypothesis – Merim Bilalic and colleagues 2009
In a subsequent paper, Kieran Smallbone and Fernand Gobet joined Bilalic and McLeod to analyze a large sample of German players. This sample was not based on FIDE ratings but on a different Elo system by the German Federation, and unlike the FIDE sample it contained information about most tournament players. They created a model to estimate the expected difference of populations of different sizes, and they showed that most of the advantage in rating was due to the greater number of male players.[9]
Refutation of the methods used by Bilalic and colleagues – Michael Knapp 2010
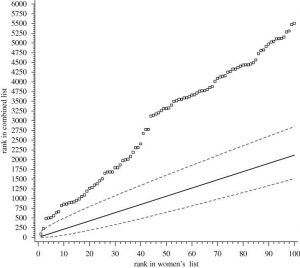
Michael Knapp criticized the method used by Bilalic and colleagues by exposing the flaws of their statistical model. He calculated that, in their own sample, the 100th female player should be ranked between 1510th and 2849th in the overall sample with a degree of confidence of 99.9%, assuming no effect of gender. However, in the actual ranking, the 100th woman was ranked 5505th.[10]
So where did Bilalic and McLeod go wrong? – Bruno Weisend 2019
Apparently, the participation rate hypothesis was born out of a statistical mistake. Bilalic and McLeod assumed that their sample was an approximately normal distribution, with a common mean as a weighted average of the female and male populations. Therefore, their conclusions that the the gender gap in top chess is due to population sizes is contingent on this false assumption.[11] We will speak more on this rich and insightful article by Weisend in the future.
Layman analysis of the problem of population sizes and the gender gap in chess
Now, let us analyze the issue from a layman point of view. The FIDE Elo ratings are available for everyone to use. Professor Ma calculated the average of female and male Indian players. In effect, when the same procedure applied by Ma is performed for the entirety of the FIDE list, the average of the senior male population is 75.5 points higher than the senior female population.[3] This is over a sample of a quarter of a million people, not precisely a fluke.
Top-countries vs women
We have already talked of how Camacho found that the vast majority of countries show a statistically significant advantages for men, both in the overall and in the top-player samples.[5] But more impressively, the average gap between the expected and the real difference between the male top-10 and the female top-10 was 98 points! This is, among the 20 countries analyzed by Camacho, the top-10 women were rated almost 100 points lower than expected by the difference in population sizes. Again, 100 points over such a large sample didn’t come by chance.

Small male samples vs women
One could argue that there is a selection bias in Camacho’s sample. Indeed, he took the top-FIDE countries as a sample, consisting on those with the highest top-10 average. Since the male populations are substantially larger, picking the top federations could signify picking the best male populations. In this sense, it could be the case that this gap exists only in the top countries but not in average. For that reason, I made some small corrections to this bias. First of all, we could apply the same procedure but picking countries by female top-10 average instead. As it turns out, the top countries are almost the same whether one picks the female or the male average.[12]
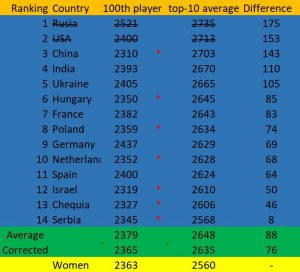
However, a better solution is to apply a completely unbiased method of analysis. If the gender gap in chess is due to population sizes, a subsample of men of the same size as the female population should have a similar top-10. The problem is that there are no countries that even approach the population size of the overall female sample of 145583 (including juniors, unrated and inactive players). The closest country is Russia,[13] with a total male population of 76948 and average active top-10 rating of 2735, while the overall active female top-10 average is 2560.[14]

100th-matched countries vs women
There are 23 countries where the average top-10 is higher than the overall female top-10, all of which have chess populations that are overwhelmingly smaller than the female sample. There are some striking cases, such as Armenia, with a male population of only 1503 players (including juniors, non-rated and inactive players), and an average top-10 of 2660, exactly 100 points above the overall female top-10.[14] Similar cases can be made of countries such as Azerbaijan and Georgia.
Extreme examples aside, I took all the countries where the 100th player was close to the overall female of the same ranking, with a rating of 2363. I included countries with a 100th player above 2300; 14 countries in total, all of which have a top-10 average that’s higher than the female top-10, with a mean of 88 points. Even when removing the two highest rated federation by top-10 average (Russia and the USA), the difference remained substantial, at 75 points. Suitably, this correction made the average rating of the 100th players in my sample almost identical to the female 100th, 2365 to 2363 respectively. It is also important to notice that 7 of these 12 countries have 100th rankings that are lower than the female 100th, but all 7 have a higher top-10 average.[14]
Adding an extreme outlier to the female ranking.
One could ponder whether this difference is produced by the absence of a strong female player at the top, such as Judit Polgar. First of all, the current female number one, Hou Yifan, is quite unusually strong if we exclude Polgar. In addition to that, eliminating the last top-10 player (Harika, 2515), and adding Magnus Carlsen (2862) to the female top-10 barely changes anything, allowing them to surpass only Serbia and stay behind the other 13 countries. But obviously Carlsens’ rating is 125 points higher than any female player at any point in history (peaking with Polgar’s 2735, July 2005). So this isn’t a very plausible scenario.
Simple refutation of the variability hypothesis.
As a footnote, the 100th player is obviously far above of the true average in almost every country, since most countries have more than 200 players. Assuming an approximately normal distributions for male ratings, the average should be close to the median, which is the value that divides the population in half. Of course, ideally we would take the average as a reference point. The problem is that the true average is difficult to calculate, since the FIDE applies a rating floor that wipes out the bottom of the distribution. This is why my argument above only proves that males are higher rated at the top and not in average. It could be that men are overrepresented at both tales, with similar average as women but much greater variability.
Indeed, men seem to show greater standard deviation, but not nearly enough to produce such advantage at the top spots. When removing the upper half of the ranking (of rated players only), both in the male and the female sample, the average rating difference in favor of men goes from 168.6 to 165.1: a very minor change.[3] This means that the gender gap at the top isn’t due to greater variability in the male sample; rather, men have a much higher average rating. No permutation test is needed, the p-value is essentially 0. In addition, let’s not forget that the FIDE ranking is as close to a census as it gets: most players are rated. There isn’t much space for inference errors or for selection biases to occur.
Extracting random samples from the male population
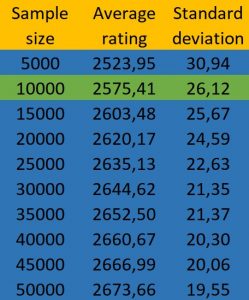
Finally, I did a little more technical and hazardous calculation. I took 100 samples of different sizes from the overall male ranking (of all FIDE affiliations, non-rated players included), and I averaged out the top ten ratings from each sample. I think this is a simpler approach to refute this hypothesis than the method used by Bilalic and others, who tried to extrapolate from a small female sample. It turns out that less than 10,000 male players are needed in order to surpass the female top-10 average (2560).
It is important to point out that 100 samples was more than enough, since the standard deviation of these samples was very small (26, with an average of 2575 for the samples of 10,000 men). In fact, the average remains constant from about 30 samples extracted. There are 145,582 women affiliated to FIDE. Thus, random samples of about 1 man for every 15 woman have a higher top-10 average.
Womer’s lower average rating has more weight than the smaller population
To put it simply, it makes no sense to say that the differences at the top are due to sample sizes, since a sample of men 15 times smaller than the female chess population has a higher top-10 average. However, we shouldn’t mistake this with the idea that men are 15 times better than women, or that a randomly selected man is better than the best of 15 women. It only means that population sizes are not that relevant for explaining the gender gap in top-level chess. The greater average rating of males is what has the greater weight. It is interesting to note that a sample of only 50,000 men has an average top-10 that’s roughly 120 points lower than the overall male population. In contrast, the female top-10 average is more than 230 points lower, with a population about 3 times larger than the sample mentioned.[3]
In conclusion
Population sizes do not explain the gender gap in top chess, as professor Wei Ji Ma claims. When matching population sizes, the gender gap in chess remains substantial.
In this article, I have merely attempted to refute the participation rate hypothesis once and for all. My interest was not to determine how large the gap is exactly or what its causes and mechanisms are. It is well-known that population studies do not show cause and effect. What we can say with great confidence is that men are better than women at chess, in average. Are the differences biological, or are they cultural? Are they due to inherent differences in the wiring of the brains of women and men, as Nigel Short famously argued?[15] Does this mean that men are intellectually superior to or more intelligent than women? These are some of the common questions we will examine in a future installment.
References:
- Ma,Wei Ji, 2020. What gender gap in chess? [online]
https://en.chessbase.com/post/what-gender-gap-in-chess - Based on FIDE ratings search.
https://ratings.fide.com/ - Calculated from the October 2020 FIDE rating list.
https://ratings.fide.com/download.phtml - Extracted from the archives of former FIDE rating lists.
https://www.olimpbase.org/Elo/ - Camacho Collados, J., 2020. The Gender Gap In Top-Level Chess. [online]
https://chess24.com/en/read/news/the-gender-gap-in-top-level-chess - Howard, R. W. (2013). Explaining male predominance in chess. [online]
https://en.chessbase.com/post/explaining-male-predominance-in-chess - The amount of competitive games played is known to be one of the main predictors of chess strength
- Bilalic, M., & Mcleod, P. (2007). Participation rates and the difference in performance of women and men in chess. Journal of biosocial science, 39(5), 789.
https://www.researchgate.net/profile/Merim_Bilalic/publication/6475924_Participation_rates_and_the_difference_in_performance_of_women_and_men_in_chess/links/5d4951cc299bf1995b69838c/Participation-rates-and-the-difference-in-performance-of-women-and-men-in-chess.pdf - Bilalić, M., Smallbone, K., McLeod, P., & Gobet, F. (2009). Why are (the best) women so good at chess? Participation rates and gender differences in intellectual domains. Proceedings of the Royal Society B: Biological Sciences, 276(1659), 1161-1165.
https://www.ncbi.nlm.nih.gov/pmc/articles/PMC2679077/ - Knapp, M. (2010). Are participation rates sufficient to explain gender differences in chess performance?. Proceedings of the Royal Society B: Biological Sciences, 277(1692), 2269-2270.
https://www.ncbi.nlm.nih.gov/pmc/articles/PMC2894898/ - Weisend, B., 2019. Questioning Gender Studies on Chess. [online]
https://en.chessbase.com/portals/all/2019/05/chess-gender/wiesend_questioning%20gender%20studies%20on%20chess.pdf - Top Female rankings by country
https://ratings.fide.com/topfed.phtml?tops=1
Top mixed rankings by country https://ratings.fide.com/topfed.phtml?tops=0&ina=1&country - Rating analytics: The number of rated chess players goes up.
https://www.fide.com/news/288 - (These figures are calculated from FIDE rating advanced searches)
https://ratings.fide.com/ - https://www.theguardian.com/world/2015/apr/20/nigel-short-uk-grandmaster-men-hardwired-better-chess-players-women
Pingback:URL
Pingback:CZ Shotguns
Pingback:chiappa shotguns
Pingback:sccy pistols
Pingback:Charter firearms
Pingback:บุหรี่นอกราคาถูก
Pingback:เว็บพนันออนไลน์
Pingback:slot online
Pingback:เรือไปเกาะหลีเป๊ะ
Pingback:ข่าวกีฬา
Pingback:สล็อต ฝากถอน true wallet เว็บตรง 888pg
Pingback:สล็อต ฝากถอน true wallet เว็บตรง 888pg
Pingback:snus
Pingback:ทินเนอร์ AAA
Pingback:togel sgp
Pingback:Muay Thai Ticket Bangla
Pingback:สล็อต pg เว็บตรง แตกหนัก
Pingback:ป้ายโฆษณา
Pingback:เว็บพนันบอล ดีที่สุด
Pingback:slot88
Pingback:betmw168
Pingback:คอนโดพัทยา
Pingback:พรมปูพื้นรถยนต์ 6d
Pingback:220.lv
Pingback:pool villas in phuket
Pingback:สติ๊กเกอร์โลโก้
Pingback:สถาปนิกรับออกแบบบ้าน
Pingback:ล่ามภาษาญี่ปุ่น
Pingback:สติ๊กเกอร์โลโก้
Pingback:yehyeh com
Pingback:Data SGP
Pingback:Bilskrotning Uddevalla
Pingback:Skrota bilen Göteborg
Pingback:บาคาร่า คือ อะไร มีที่มาอย่างไร
Pingback:เพิ่มผู้ติดตาม
Pingback:My Homepage