
How many female chess players are needed to match the men’s top-10? (by Alejandro Tello)
I recently published an article showing that the gap between men and women in top chess is not entirely due to population sizes. I was curious to know how much the female population should increase in order for women to have a fair representation in top-level chess. Since the FIDE rating list is publicly available, I used it to perform some calculations in order to clarify this matter.[1]
Summary of the results:
– In order to match the male top-10 average rating, the female population would require to be more than 10 times larger than the current male population.
– If the female population of chess players was as large as the male population, the average top-10 would be about 2675. This is 120 points lower than the current male top-10.
The procedure
I took 100 samples of a given size, I calculated the top-10 average in each sample and averaged them all out. In other words, I calculated the average top-10 rating from 100 samples of a given size. I did the same thing for different sample sizes and plotted the results against the population increase, on a logarithmic scale. This means that for every point increase in the X-axis, the sample size is doubled. Then I used automatic regression with a spreadsheet and chose the function that best fit the data, a power function.
The results
The regression shows that, in order to match the men’s average top-10 (2795 Elo points), the female population should double approximately 6 times. The current female population has 145,581 players. This means that 9,317,184 female players are needed to achieve the target rating. This is more than 11 times larger than the current male population of chess players. In In other words, we would need 11 women for every man in order to equate their average top-10 ratings.

Explaining the results
The blue dots are the data points, while the dotted line is the regression. The reason why the X-axis starts at 5 is because smaller populations would often yield less than 10 rated players, which would bias the average. The number 14 corresponds to the current total population of female players; 13 represents samples of size 72791, which is half of the total population; 12 are samples of half that amount (36395), and so on until the smallest of 284 players. The smaller samples were removed for the reasons I explained above.
The Y-axis represents the average top-10 rating of the average of the samples extracted (yes, too many averages there…). You can see that as samples increase, the average increase in top-10 average decreases, even though the x-axis is on a logarithmic scale. This means that doubling the population of players doesn’t increase the average top-10 rating in a linear fashion.
Matching the male and female population sizes
Another interesting question is what would be the female top-10 average if there were as many female players as there are males. In order to calculate this, first I divided the total number of male players by the total number of female players, and I got 5.74. This means that the male population is 5.74 times larger. However, let’s not forget that my regression is on a logarithmic scale, so I took the square root of this number, which gave me roughly 2.4. This entails that you need to double the female population 2.4 times in order to make it as large as the male population. Now, we need to add 14 to this number, because this is the number that corresponds to the current population, and finally replace it in the regression equation. This gave a rating of 2675! So this would be the average rating of the female top-10, according to our model. Incidentally, this is the exact same rating of the current female number one, Judit Polgar!
Limitations of the results
As a disclaimer, I must warn that this is a rough calculation, and it was made merely out of curiosity: it does not pretend to be an accurate prediction in any way. It’s well-known in statistics that extrapolations are tricky. First of all, it is very likely that the function chosen doesn’t produce the most accurate fit for the data. That would produce deviations in the prediction that would increase as the prediction becomes more far reaching. In addition to that, populations don’t grow homogeneously, as it is assumed in this oversimplified analysis. It is likely that changes in population size come with changes its demographic characteristics.
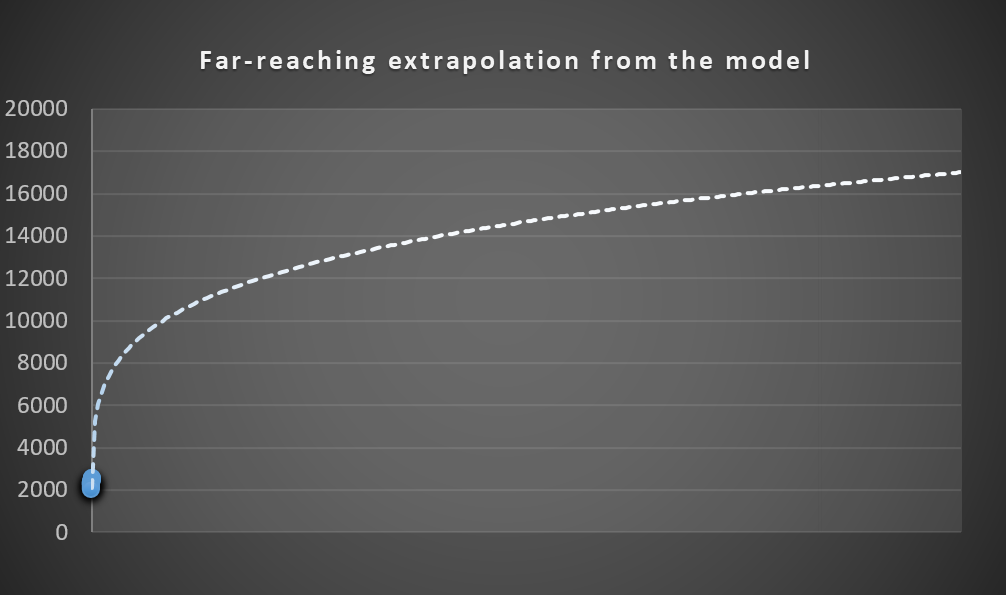
A flaw with this model is that it predicts that the rating celling will increase indefinitely, which is unlikely. In real life, the average top-10 would probably level off much faster. So my guess is that the prediction made by the model is slightly optimistic. The graph below shows an extrapolation of this regression model to extremely large values. As you can see, ratings grow in a near-linear fashion until ratings in the range of the 4000s (the current number 1 player in the world is rated around 2860).
Conclusion
Although by no means conclusive, these calculations show that it is extremely unlikely that women ever compete in equal terms with men at chess, by means of merely popularizing the game and incentivicing female participation.
Notes:
- Calculations were based on the FIDE rating list of the first of October of 2020, in agreement with my previous article.